#include <Plot.h>
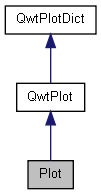
Inheritance diagram for Plot:
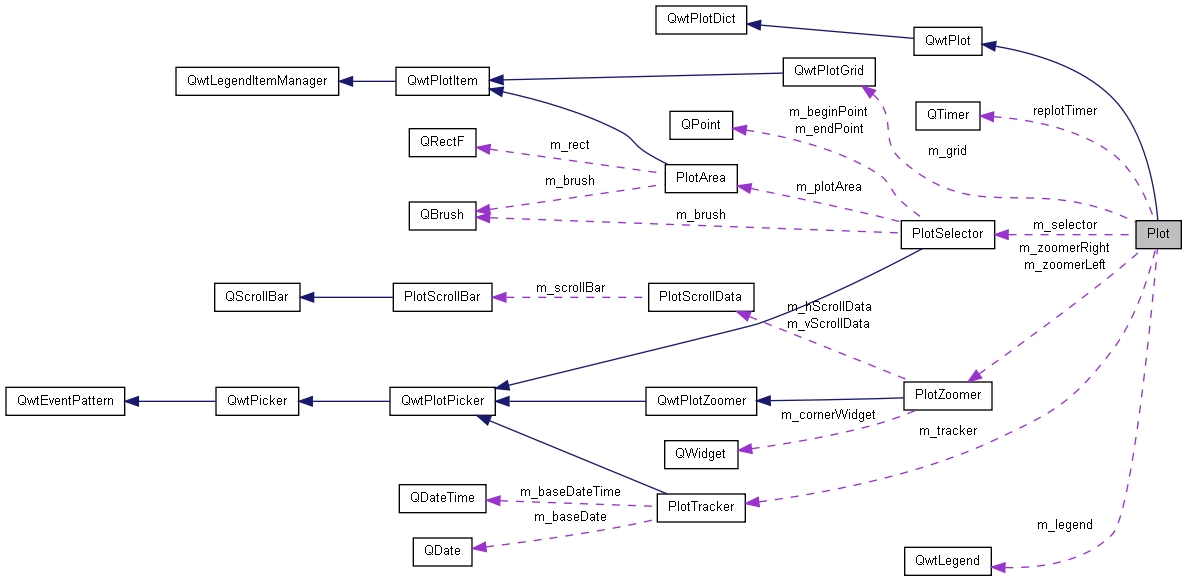
Collaboration diagram for Plot:
Public Slots | |
| void | showCurve (QwtPlotItem *item, bool flag) |
| void | curveContextMenuRequested (const QPoint &point) |
| void | replot () |
Signals | |
| void | curveContextMenuRequested (const QPoint &point, PlotCurve *curve) |
| void | canvasContextMenuRequested (const QPoint &point, PlotCurve *curve) |
| void | canvasMousePressed (const QPoint &point) |
| void | mouseMoved () |
| void | deleteKeyPressed () |
| void | signal_curveAttached (PlotCurve *curve) |
Public Member Functions | |
| Plot (QWidget *parent=0) | |
| virtual | ~Plot () |
| PlotTracker * | tracker () |
| PlotZoomer * | zoomerLeft () |
| PlotZoomer * | zoomerRight () |
| PlotSelector * | selector () |
| QwtPlotGrid * | grid () |
| void | enableGrid (bool flag) |
| bool | gridIsEnabled () |
Protected Member Functions | |
| virtual void | resizeEvent (QResizeEvent *e) |
| void | mousePressEvent (QMouseEvent *event) |
| void | mouseMoveEvent (QMouseEvent *event) |
| void | keyPressEvent (QKeyEvent *event) |
Constructor & Destructor Documentation
| Plot::Plot | ( | QWidget * | parent = 0 |
) |
  : QwtPlot( parent )
{
  //qDebug( "Plot::Plot" );
    // replotTimer
    connect(&replotTimer, SIGNAL(timeout()), this, SLOT(replot()), Qt::QueuedConnection);
    replotTimer.setSingleShot(true);

//  connect( axisWidget( QwtPlot::xBottom ), SIGNAL( scaleDivChanged() ),
//           this, SLOT( filterData() ) );

  // Legend
  m_legend = new QwtLegend();
  m_legend->setItemMode( QwtLegend::CheckableItem );
  insertLegend( m_legend, QwtPlot::RightLegend );
  connect( this, SIGNAL( legendChecked( QwtPlotItem*, bool ) ),
           SLOT( showCurve( QwtPlotItem*, bool ) ) );

  // Tracker
  m_tracker = new PlotTracker( canvas() );

  // Zoomers
  //m_zoomerLeft = NULL;
  m_zoomerLeft = new PlotZoomer( canvas() );
  m_zoomerLeft->setHScrollBarPosition( PlotZoomer::OppositeToScale );
  m_zoomerLeft->setVScrollBarPosition( PlotZoomer::OppositeToScale );
  m_zoomerRight = new PlotZoomer( canvas() );
  m_zoomerRight->setAxis( QwtPlot::xTop, QwtPlot::yRight );
  m_zoomerRight->setHScrollBarPosition( PlotZoomer::AttachedToScale );
  m_zoomerRight->setVScrollBarPosition( PlotZoomer::AttachedToScale );
  // Sync the right zoomer based on a movement of the scrollbar of the left zoomer
  connect( m_zoomerLeft, SIGNAL( scrollBarMovedSignal( Qt::Orientation, double, double, double, double ) ),
           m_zoomerRight, SLOT( otherScrollBarMoved( Qt::Orientation, double, double, double, double ) ) );

  // Selector
  m_selector = new PlotSelector( canvas() );

  // Grid
  m_grid = new QwtPlotGrid();
  m_grid->enableXMin( true );
  m_grid->enableYMin( true );
  m_grid->setMajPen( QPen( QColor( 160, 160, 160 ), 0, Qt::SolidLine ) );
  m_grid->setMinPen( QPen( QColor( 200, 200, 200 ), 0, Qt::SolidLine ) );
  m_grid->attach( this );

  // Canvas
  setCanvasBackground( Qt::white );
  canvas()->setContextMenuPolicy( Qt::CustomContextMenu );

  // Fonts
  QwtText axisTitle( "" );
  axisTitle.setFont( QFont( "Arial", 10 ) );
  setAxisTitle( QwtPlot::yLeft, axisTitle );
  setAxisTitle( QwtPlot::yRight, axisTitle );
  setAxisTitle( QwtPlot::xBottom, axisTitle );
  setAxisTitle( QwtPlot::xTop, axisTitle );
  //setAxisScaleDraw( QwtPlot::xBottom, new QwtScaleDraw() );
  setAxisFont( QwtPlot::yLeft, QFont( "Arial", 9 ) );
  setAxisFont( QwtPlot::yRight, QFont( "Arial", 9 ) );
  setAxisFont( QwtPlot::xBottom, QFont( "Arial", 9 ) );
  setAxisFont( QwtPlot::xTop, QFont( "Arial", 9 ) );

  // Context menu and mouse tracking
  setContextMenuPolicy( Qt::CustomContextMenu );
  setMouseTracking( true );
}
| Plot::~Plot | ( | ) | [virtual] |
{
  //qDebug( "Plot::~Plot" );
}
Member Function Documentation
| void Plot::canvasMousePressed | ( | const QPoint & | point | ) | [signal] |
Referenced by mousePressEvent().
Referenced by curveContextMenuRequested().
| void Plot::curveContextMenuRequested | ( | const QPoint & | point | ) | [slot] |
{
  //qDebug( "Plot::curveContextMenuRequested" );

  QObject* sender = QObject::sender();
  if ( sender == NULL ) return;
  QwtLegendItemManager* legendItem = legend()->find( ( QWidget* )sender );
  if ( legendItem == NULL ) return;
  PlotCurve* plotCurve = dynamic_cast< PlotCurve* >( legendItem );
  if ( plotCurve == NULL ) return;
  emit curveContextMenuRequested( point, plotCurve );
}
| void Plot::deleteKeyPressed | ( | ) | [signal] |
Referenced by keyPressEvent().
| void Plot::enableGrid | ( | bool | flag | ) | [inline] |
                              {
        if (flag && !gridIsEnabled()) m_grid->attach(this);
        if (!flag && gridIsEnabled()) m_grid->detach();
    }
| QwtPlotGrid* Plot::grid | ( | ) | [inline] |
{ return m_grid; }
| bool Plot::gridIsEnabled | ( | ) | [inline] |
Referenced by enableGrid().
                        {
        return static_cast<bool>(m_grid->plot());
    }
| void Plot::keyPressEvent | ( | QKeyEvent * | event | ) | [protected] |
{
  //qDebug( "Plot::keyPressEvent" );

  if ( event->key() == Qt::Key_Delete )
  {
    emit deleteKeyPressed();
  }

  QwtPlot::keyPressEvent( event );
}
| void Plot::mouseMoved | ( | ) | [signal] |
Referenced by mouseMoveEvent().
| void Plot::mouseMoveEvent | ( | QMouseEvent * | event | ) | [protected] |
{
  //qDebug( "Plot::mouseMoveEvent" );

  emit mouseMoved();

  QwtPlot::mouseMoveEvent( event );
}
| void Plot::mousePressEvent | ( | QMouseEvent * | event | ) | [protected] |
{
  //qDebug( "Plot::mousePressEvent" );

  if ( canvas()->rect().contains( canvas()->mapFromParent( event->pos() ) ) == true )
  {
    emit canvasMousePressed( canvas()->mapFromParent( event->pos() ) );
  }

  QwtPlot::mousePressEvent( event );
}
| void Plot::replot | ( | ) | [slot] |
Reimplemented from QwtPlot.
Referenced by Plot(), Grapher::removeCurve(), and showCurve().
            {
    //qDebug() << "replot asked by: " << sender();
    static const int timeOut = 25;
    if (replotTimer.isActive()) {
        replotTimer.start(timeOut);
    } else {
        if (sender() == &replotTimer) {
            // only now will replot() be executed

            // disable yLeft or yRight if not used
            QList<QwtPlotItem*> plotItems = itemList();
            bool yLeft(false);
            bool yRight(false);
            bool xBottom(false);
            QList<QwtPlotItem*>::iterator i = plotItems.begin();
            while(!(yLeft && yRight) && !(i == plotItems.end())){
                int rtti = (*i)->rtti();
                if (rtti == 1 /*=Grid*/ || rtti == 1001 /*=PlotSelector*/){
                    i++;
                    continue;
                }
                xBottom = true;
                int axis = (*i)->yAxis();
                if (axis == QwtPlot::yLeft) yLeft = true;
                if (axis == QwtPlot::yRight) yRight = true;
                i++;
            }
            enableAxis(QwtPlot::yLeft, yLeft);
            enableAxis(QwtPlot::yRight, yRight);
            enableAxis(QwtPlot::xBottom, xBottom);

            // replot
            QTime t;
            t.start();
            QwtPlot::replot();
            qDebug() << "Replotting took: " << t.elapsed() << "msec";
        } else {
            replotTimer.start(timeOut);
        }
    }
}
| void Plot::resizeEvent | ( | QResizeEvent * | e | ) | [protected, virtual] |
Reimplemented from QwtPlot.
{
  //qDebug( "Plot::resizeEvent" );

//  // Adjust the canvas gradient
//  adjustCanvasGradient();

//  // Throw out excessive data
//  filterData();

  // If the zoomer is disabled, it won't get any events so we need to update the toolbars explicitly
  if ( m_zoomerLeft != NULL )
  {
    m_zoomerLeft->updateScrollBars();
  }
  if ( m_zoomerRight != NULL )
  {
    m_zoomerRight->updateScrollBars();
  }

  QwtPlot::resizeEvent( e );
}
| PlotSelector* Plot::selector | ( | ) | [inline] |
Referenced by PlotWidget::enableSelect(), and PlotWidget::enableZoom().
{ return m_selector; }
| void Plot::showCurve | ( | QwtPlotItem * | item, | |
| bool | flag | |||
| ) | [slot] |
Referenced by PlotCurve::attach(), and Plot().
{
  //qDebug( "Plot::showCurve" );

  item->setVisible( flag );
  // Switch whether the boundingRect() of this item is included in the autoscaling calculation
  item->setItemAttribute( QwtPlotItem::AutoScale, flag );
  QWidget* w = legend()->find( item );
  if ( w && w->inherits( "QwtLegendItem" ) )
  {
    ( ( QwtLegendItem* ) w )->setChecked( flag );
  }

  if ( autoReplot() == true )
  {
    QTimer::singleShot(0, this, SLOT(replot()));
  }
}
| void Plot::signal_curveAttached | ( | PlotCurve * | curve | ) | [signal] |
| PlotTracker* Plot::tracker | ( | ) | [inline] |
Referenced by PlotMoveableMarker::eventFilter(), PlotWidget::setAxisDate(), PlotWidget::setAxisDateTime(), PlotWidget::setAxisLinear(), and PlotWidget::setAxisLogarithmic().
{ return m_tracker; }
| PlotZoomer* Plot::zoomerLeft | ( | ) | [inline] |
Referenced by PlotWidget::enableSelect(), and PlotWidget::enableZoom().
{ return m_zoomerLeft; }
| PlotZoomer* Plot::zoomerRight | ( | ) | [inline] |
Referenced by PlotWidget::enableSelect(), and PlotWidget::enableZoom().
{ return m_zoomerRight; }
The documentation for this class was generated from the following files: