Main window for drawing data. More...
#include <grapher.h>
Inheritance diagram for Grapher:
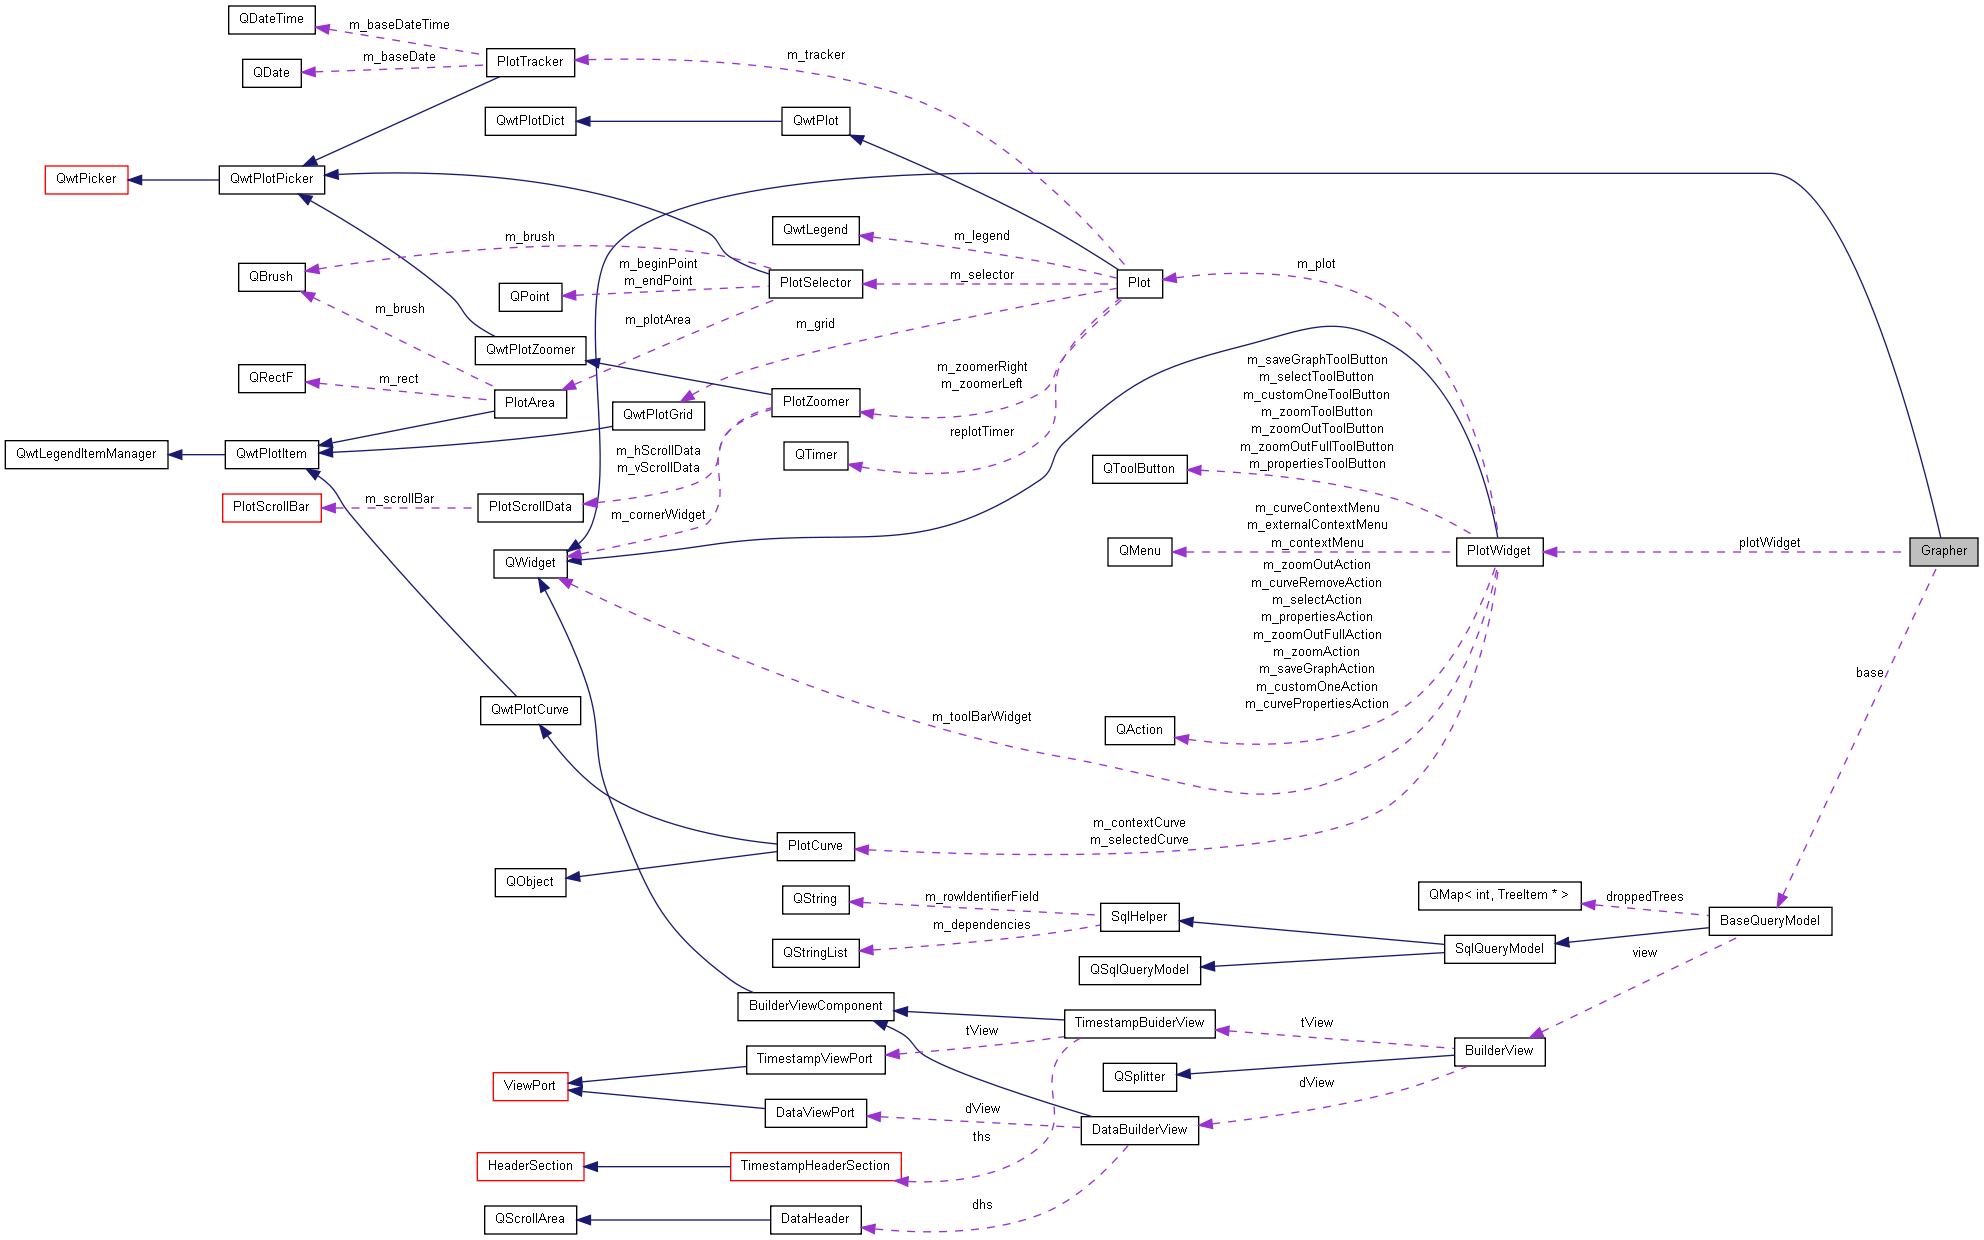
Collaboration diagram for Grapher:
Public Slots | |
| void | addCurve (PlotCurve *curve) |
| void | removeCurve (PlotCurve *curve) |
| void | removeCurve (int logicalIndex) |
Public Member Functions | |
| Grapher (BaseQueryModel *base, QWidget *parent=0) | |
Detailed Description
Main window for drawing data.
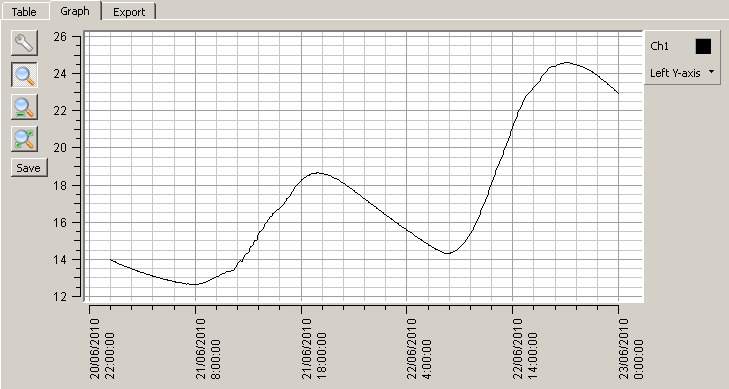
Each column you selected for graphing in the Builder is here plotted. Currently you can chose the color and axis for each plot. Other functions might be implemented on request.
You can zoom in/out and adjust the axis scopes and grid lines.
You can save the image as a BMP or JPEG image.
Constructor & Destructor Documentation
| Grapher::Grapher | ( | BaseQueryModel * | base, | |
| QWidget * | parent = 0 | |||
| ) |
                                                                : QWidget(parent) {
    setObjectName("Grapher");
    this->base = base;

    plotWidget = new PlotWidget(this);
    plotWidget->enableSelect(false);
    plotWidget->setAxisDateTime(Plot::xBottom, QDateTime::fromTime_t(0));
    plotWidget->plot()->setAutoReplot(true);

    //        plotWidget->setToolBarIconSize( QSize( 16, 16 ) );
    //        plotWidget->setContentsMargins( 2, 2, 2, 2 );

    //        QFont font = plotWidget->plot()->axisFont( QwtPlot::yLeft );
    //        font.setPointSize( 8 );
    //        plotWidget->plot()->setAxisFont( QwtPlot::yLeft, font );
    //        plotWidget->plot()->setAxisFont( QwtPlot::yRight, font );
    //        plotWidget->plot()->setAxisFont( QwtPlot::xBottom, font );
    //        plotWidget->plot()->setAxisFont( QwtPlot::xTop, font );
    //        plotWidget->plot()->tracker()->setTrackerFont( font );
    //        plotWidget->plot()->setMargin( 2 );

    setLayout(new QVBoxLayout());
    layout()->addWidget(plotWidget);

#ifdef DEBUG_MODELSPEED
    QPushButton *speedTest = new QPushButton("ModelSpeed", this);
    connect(speedTest, SIGNAL(clicked()), this, SLOT(testQuerySpeed()));
    layout()->addWidget(speedTest);
#endif //DEBUG_MODELSPEED
};
Member Function Documentation
| void Grapher::addCurve | ( | PlotCurve * | curve | ) | [slot] |
| void Grapher::removeCurve | ( | int | logicalIndex | ) | [slot] |
| void Grapher::removeCurve | ( | PlotCurve * | curve | ) | [slot] |
The documentation for this class was generated from the following files: