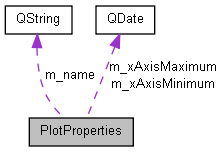
#include <PlotProperties.h>
List of all members.
Member Enumeration Documentation
- Enumerator:
| Lines |
|
| Dots |
|
| DotsLines |
|
| ThinLines |
|
Constructor & Destructor Documentation
| PlotProperties::PlotProperties |
( |
|
) |
|
| PlotProperties::~PlotProperties |
( |
|
) |
[virtual] |
Member Function Documentation
| void PlotProperties::enableGrid |
( |
bool |
flag |
) |
[inline] |
{ m_enableGrid = flag; };
| bool PlotProperties::isGridEnabled |
( |
|
) |
[inline] |
| LineStyle PlotProperties::lineStyle |
( |
|
) |
[inline] |
| QString PlotProperties::name |
( |
|
) |
[inline] |
{
if ( name == "PlotProperties" )
{
m_name = attributes.value( "Name" ).toString();
m_lineStyle = ( LineStyle )attributes.value( "LineStyle" ).toString().toInt();
m_enableGrid = ( bool )attributes.value( "EnableGrid" ).toString().toInt();
m_xAxisAutoscale = ( bool )attributes.value( "XAxisAutoscale" ).toString().toInt();
m_xAxisMinimum = QDate::fromString( attributes.value( "XAxisMinimum" ).toString(), QLocale::system().dateFormat( QLocale::ShortFormat ) );
m_xAxisMaximum = QDate::fromString( attributes.value( "XAxisMaximum" ).toString(), QLocale::system().dateFormat( QLocale::ShortFormat ) );
m_yAxisAutoscale = ( bool )attributes.value( "YAxisAutoscale" ).toString().toInt();
m_yAxisMinimum = attributes.value( "YAxisMinimum" ).toString().toDouble();
m_yAxisMaximum = attributes.value( "YAxisMaximum" ).toString().toDouble();
}
return true;
}
| void PlotProperties::setLineStyle |
( |
LineStyle |
style |
) |
[inline] |
{ m_lineStyle = style; };
| void PlotProperties::setName |
( |
QString |
name |
) |
[inline] |
| void PlotProperties::setXAxisAutoscale |
( |
bool |
flag |
) |
[inline] |
{ m_xAxisAutoscale = flag; };
| void PlotProperties::setXAxisMaximum |
( |
QDate |
date |
) |
[inline] |
{ m_xAxisMaximum = date; };
| void PlotProperties::setXAxisMinimum |
( |
QDate |
date |
) |
[inline] |
{ m_xAxisMinimum = date; };
| void PlotProperties::setYAxisAutoscale |
( |
bool |
flag |
) |
[inline] |
{ m_yAxisAutoscale = flag; };
| void PlotProperties::setYAxisMaximum |
( |
double |
maximum |
) |
[inline] |
{ m_yAxisMaximum = maximum; };
| void PlotProperties::setYAxisMinimum |
( |
double |
minimum |
) |
[inline] |
{ m_yAxisMinimum = minimum; };
{
QString xmlString;
QTextStream stream( &xmlString );
QString indent = " ";
stream << "<PlotProperties"
<< " Name=\"" << m_name << "\""
<< " LineStyle=\"" << m_lineStyle << "\""
<< " EnableGrid=\"" << m_enableGrid << "\""
<< " XAxisAutoscale=\"" << m_xAxisAutoscale << "\""
<< " XAxisMinimum=\"" << m_xAxisMinimum.toString( QLocale::system().dateFormat( QLocale::ShortFormat ) ) << "\""
<< " XAxisMaximum=\"" << m_xAxisMaximum.toString( QLocale::system().dateFormat( QLocale::ShortFormat ) ) << "\""
<< " YAxisAutoscale=\"" << m_yAxisAutoscale << "\""
<< " YAxisMinimum=\"" << m_yAxisMinimum << "\""
<< " YAxisMaximum=\"" << m_yAxisMaximum << "\""
<< ">\n";
stream << "</PlotProperties>\n";
return xmlString;
}
| bool PlotProperties::xAxisAutoscale |
( |
|
) |
[inline] |
| QDate PlotProperties::xAxisMaximum |
( |
|
) |
[inline] |
| QDate PlotProperties::xAxisMinimum |
( |
|
) |
[inline] |
| bool PlotProperties::yAxisAutoscale |
( |
|
) |
[inline] |
| double PlotProperties::yAxisMaximum |
( |
|
) |
[inline] |
| double PlotProperties::yAxisMinimum |
( |
|
) |
[inline] |
The documentation for this class was generated from the following files:

 1.7.1
1.7.1